

Chandra’s 4 July 4 images turn America 250 into red, white and blue cosmic music
NASA released four Chandra X-ray images plus sonifications, mapping X-ray data into sound for the July 4 anniversary.
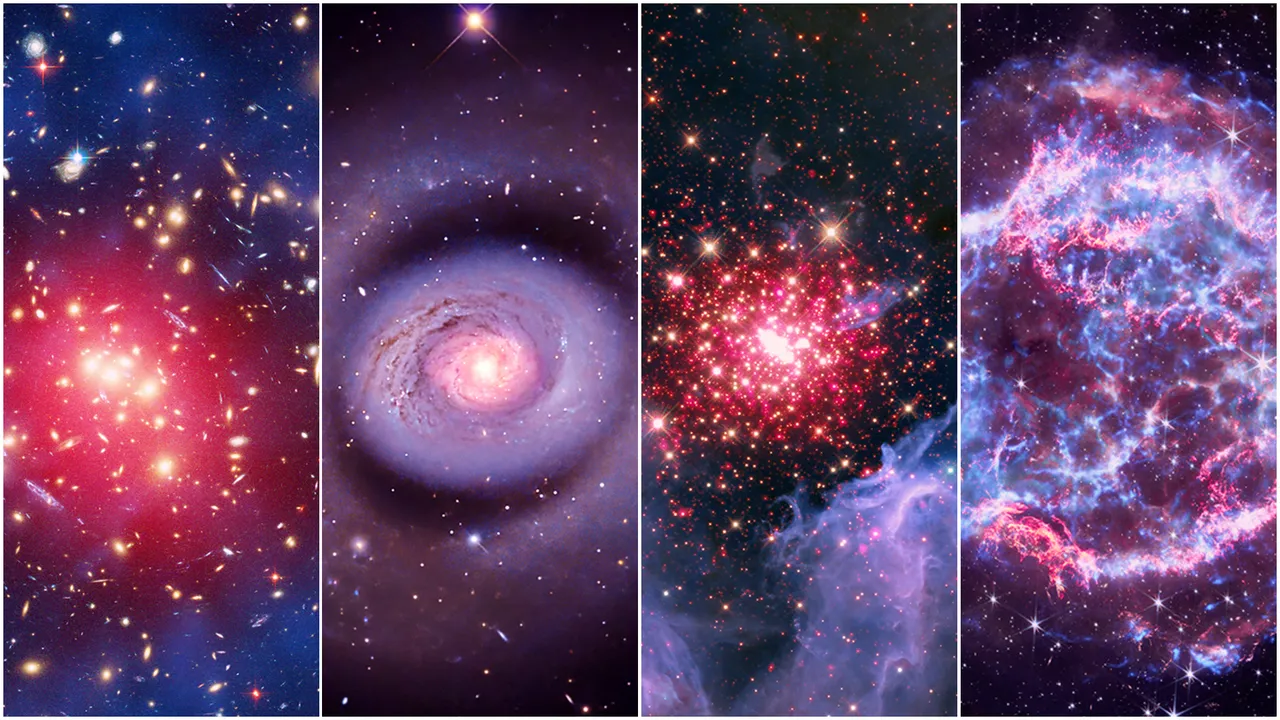
NASA’s Chandra X-ray Observatory team released four America 250-themed space telescope images on July 4, rendered in red, white and blue. The release also includes sonifications that translate Chandra’s X-ray data into audio frequencies and instrument-like sounds.
NASA’s Chandra X-ray Observatory didn’t just publish four new images for America 250 on July 4. The agency paired the visuals with something stranger and more compelling: sonifications that translate the Chandra telescope’s X-ray data into sound, effectively turning high-energy astronomy into “celestial music.”
The four images themselves are a tour through the universe’s most violent and illuminating processes, all color-coded in red, white and blue to match the anniversary. First up is galaxy cluster ZwCl 0024+1652, showing vast amounts of superheated gas around distant galaxies about 4 billion light-years away in the Pisces constellation. Next is Messier 94, also known as NGC 4736 or the “Cat’s Eye Galaxy,” a spiral galaxy about 16 million light-years away, whose inner region includes a starburst ring where new stars are being born. Third is NGC 3603, a glowing nebula in the Milky Way about 20,000 light-years away in the Carina constellation, revealed through combined X-ray and multi-wavelength data from NASA’s Chandra X-ray Observatory and the Hubble Space Telescope. Finally, there is Cassiopeia A, a supernova remnant whose original explosion is seen as a bright point of light in the Cassiopeia constellation in the 17th century, but whose actual event happened over 10,000 years ago due to its distance of about 11,000 light-years. Chandra’s data is combined with infrared light from the James Webb Space Telescope to visualize the shell of gas in reds, whites and blues.
If you are a decision-maker in a media, science communication, or tech-adjacent organization, the interesting part is not just that the pictures are beautiful. It is the pipeline: NASA is using X-ray measurements, then remapping them into other sensory formats and other wavelengths, and then packaging the result for mass attention on a fixed date. The source explicitly notes that the Chandra team produced sonifications, where X-ray data is translated into sound, mapping different audio frequencies and musical instrument sounds to the underlying measurements. That is a non-trivial choice. It tells you NASA is treating data like something meant to be experienced, not merely studied, and that it sees audiences as reachable without diluting the underlying science.
The first image, ZwCl 0024+1652, makes that translation concrete. According to NASA, the red in the image is produced from X-ray data collected by Chandra, revealing superheated gas surrounding the galaxies. The image also combines Chandra’s X-ray data with optical data from the Hubble Space Telescope, shown in blue. That blue includes the presence of dark matter, detected indirectly because dark matter does not interact with light and cannot be imaged directly. Instead, astronomers detect it through the gravitational influence it has on matter that does interact with light. So even in a “red, white and blue” aesthetic, the underlying story is about detection methods and the difference between what you can see directly versus what you can infer.
Messier 94 then adds another twist: not all galaxies behave “normally” when it comes to dark matter. The Chandra data is combined with visible light photography from telescopes here on Earth, revealing the starburst ring in the inner region of M94. The source says M94 is notable for its curious lack of dark matter, according to NASA. NASA writes that astronomers do not know why it lacks the normal amount of dark matter, but the galaxy has been the subject of extensive study as a result. For executives, that is a reminder that the most marketable science moments often come from uncertainty, not certainty. A visually striking release can point audiences toward unanswered questions, which helps keep attention grounded in real research friction.
NGC 3603 shows how NASA stitches a physical environment together across instruments. The image combines Chandra X-ray data with optical, infrared, and ultraviolet light from the Hubble Space Telescope, revealing a twinkling cluster of gases and thousands of stars known as NGC 3603. The nebula sits about 20,000 light-years away in the Milky Way in the Carina constellation, and it is described as a vast region of gas and dust surrounding a dense concentration of massive stars. NASA also notes that NGC 3603 contains some of the most massive stars in the known universe, and that these huge stars live fast and die young, burning through their hydrogen fuel quickly and ultimately ending their lives in supernova explosions.
Finally, Cassiopeia A brings the full time-delay drama of deep space and the multi-telescope mashup. The source explains that when stars die they explode in massive events known as supernovas. The light from one of the most well-known examples reached Earth in the 17th century, appearing as a bright point of light in the Cassiopeia constellation, but because the exploded star is about 11,000 light-years away, the supernova actually occurred over 10,000 years ago. Today, the leftover gases are known as Cassiopeia A. Astronomers believe the original star was somewhere in the neighborhood of 15 to 25 times more massive than the sun. In the image, Chandra’s X-ray data is combined with infrared light from the James Webb Space Telescope to help visualize the luminous shell of gas in reds, whites and blues.
Taken together, this is a smart communications play with real operational implications: NASA is demonstrating that instrument data can be fused across observatories (Chandra with Hubble, Chandra with Webb, plus ground-based visible light), then re-encoded into multiple human-readable formats (color and sound) without changing what the measurements are. For peers watching budgets, public mandates, and audience competition, the stake is clear: how do you keep complex measurement legible to non-experts, especially on culturally meaningful dates like July 4? NASA’s answer here is to turn the data into an experience, then let the science stand behind the experience with concrete details about what each color and each wavelength is actually showing.
This story's Key Insights and Take-aways are locked.
Create a free account to unlock Executive Actions for one credit.
Register to UnlockAlways free for Executives Club members. Join the Club
More in Science

Alaska's 1,580-foot tsunami had warning signs. Scientists just found them.
Rapid glacier retreat, heavy rainfall, and thousands of tiny tremors preceded Alaska's 1,580-foot tsunami, a warning for every coastal community in a warming world.

The rare mutation that lets high-risk brains dodge Alzheimer's
Scientists found a natural defense against protein buildup, opening a new path to preventive treatments.

3,000 steps a day may halve Alzheimer's decline, study finds
New research links a modest daily walk to less tau buildup and nearly half the cognitive and functional decline, even for those with early signs.