

NASA’s Chandra turns US 250th into red-white-blue X-rays, plus sonifications
Four composite cosmic images and three new sound translations make the science of supernova remnants, starburst rings, and dark matter audible.
NASA’s Chandra X-ray Observatory released four red, white, and blue composite cosmic images for the United States’ 250th birthday, paired with three new sonifications. The release matters because it shows how Chandra’s data can be repackaged for broader audiences without changing what the observations actually are.
NASA’s Chandra X-ray Observatory just did something that feels weirdly modern for a 250th birthday tribute: it turned the universe into red, white, and blue X-ray composites, then added new sonifications so you can literally listen to the data. The set includes four images spanning Cassiopeia A, NGC 3603, NGC 4736 (also known as Messier 94), and the distant galaxy cluster ZwCl 0024+1652, with the agency mixing Chandra’s X-ray vision with optical and infrared observations from other NASA and ground-based instruments.
The practical payoff for decision-makers is that this is not just a pretty gallery. The composites explicitly map different kinds of measurements to different colors, and the sonifications translate the same kinds of data into sound. For example, Chandra’s X-rays in the Cassiopeia A view (represented in blue and purple) are combined with infrared data from NASA’s James Webb Space Telescope (red and white), so the image simultaneously communicates the blast wave that tore through the star and chemical elements in the debris field, like iron, calcium, and oxygen. Webb’s infrared layer adds the expanding shell of material and cosmic dust throughout the remnant. Then, in three of the bottom-row scenes, the release explains how specific scanning methods and brightness levels become volume, pitch, tones, and timbre.
Zoom in on the science, and you get a fast tour of why X-rays are such a big deal. In Cassiopeia A, Chandra highlights what energetic processes are doing right now in the aftermath of a supernova. In the nebula NGC 3603, the new composite combines Chandra’s X-ray data (red and white) with Hubble’s optical, infrared, and ultraviolet light (red-orange, green, blue, and yellow). That layering makes the region look primarily red, white, and blue, while the X-rays reveal the “sparkling lights of young stars” in a field that also contains dust and gas. In other words, the same object is telling two stories at once: where the stars are, and where the high-energy activity is.
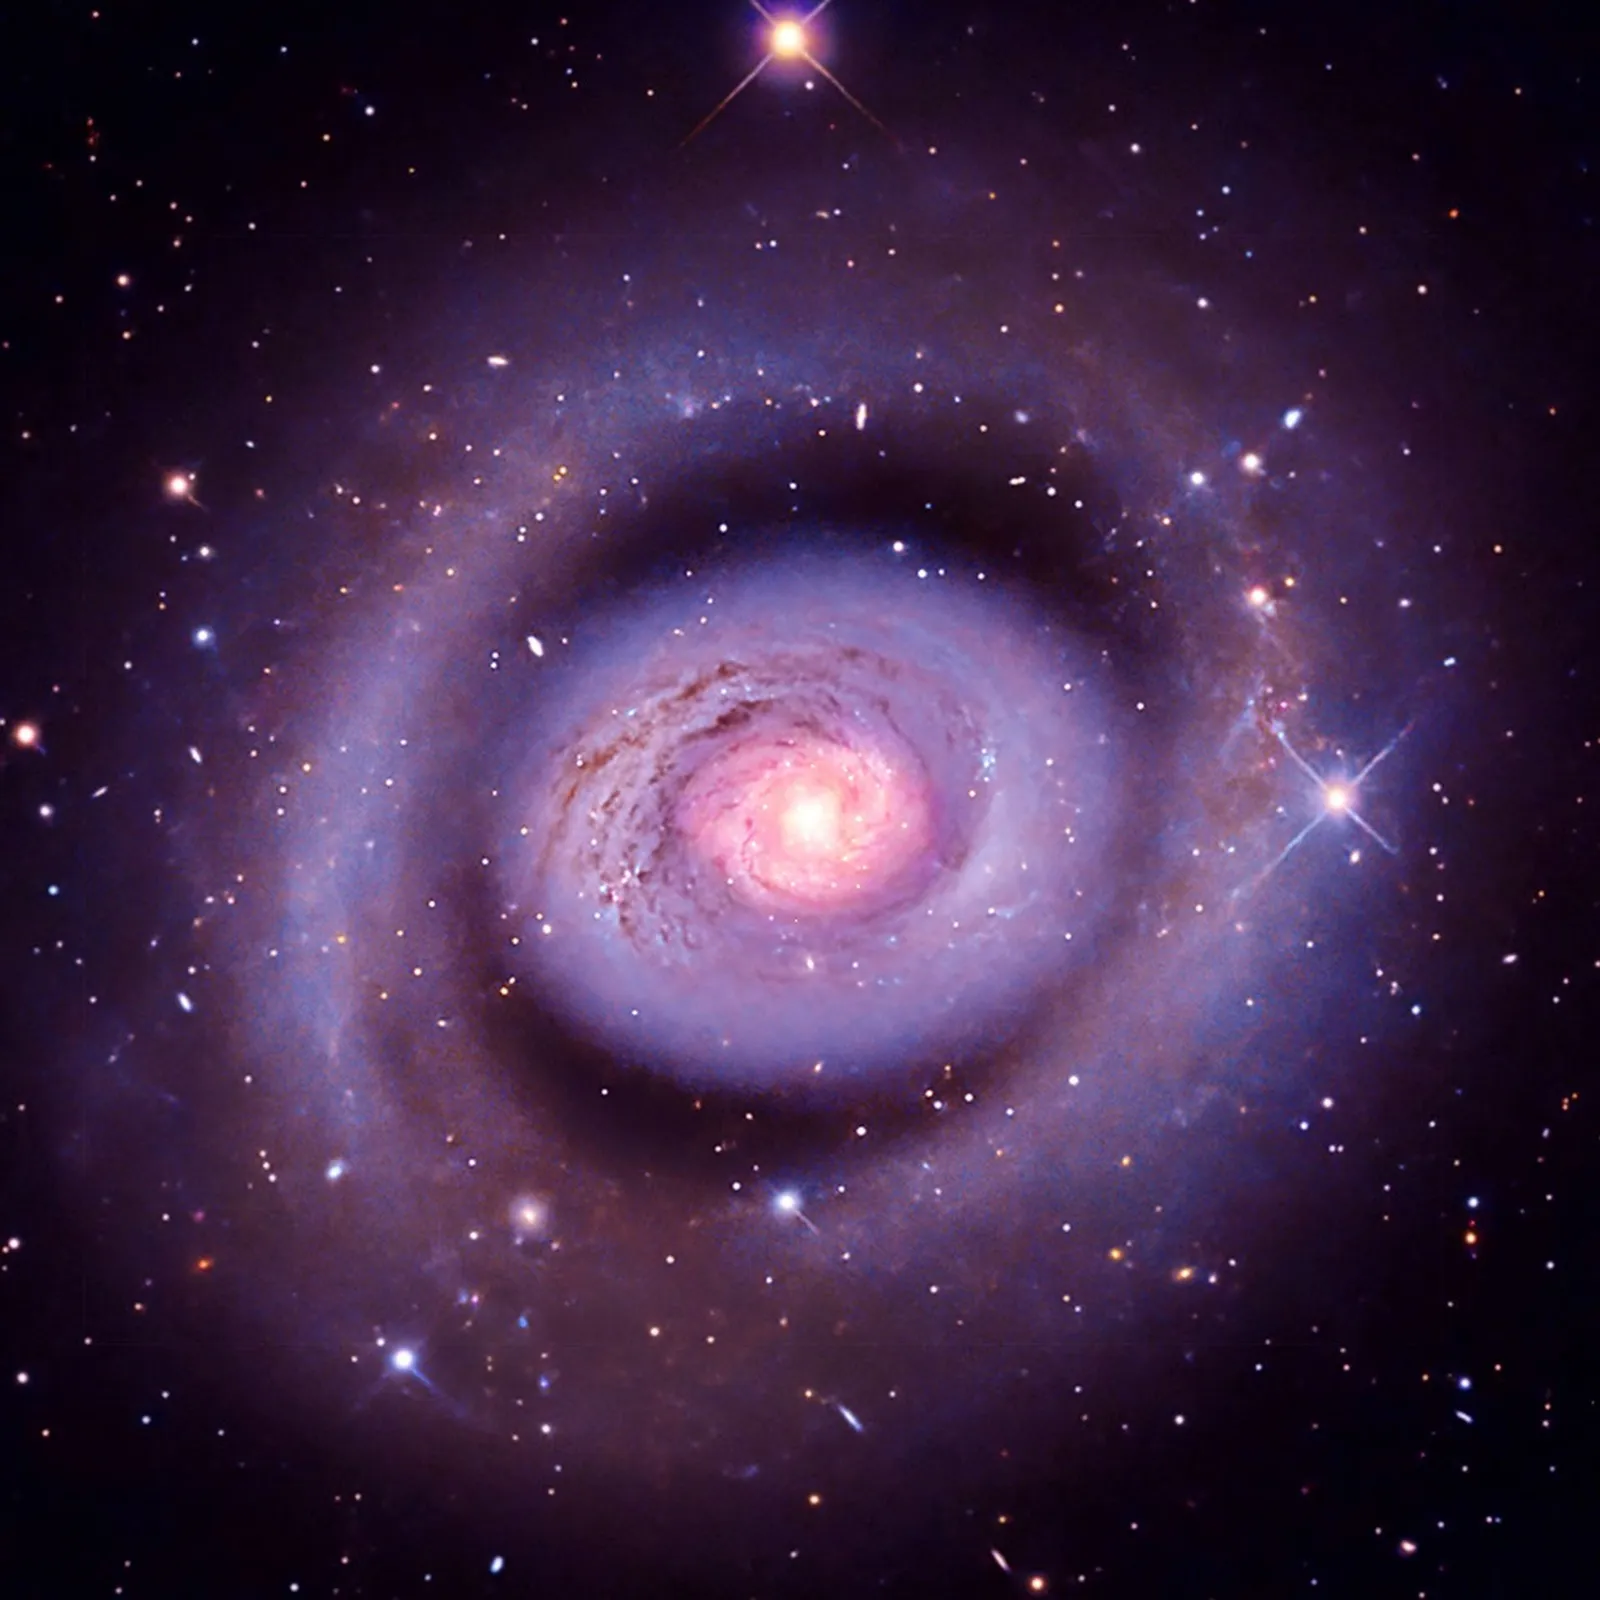
The release also leans into how multi-wavelength astronomy helps answer questions that any single instrument cannot. The middle panel of the bottom row is a new look at the galaxy NGC 4736, also known as Messier 94. Chandra’s X-rays at different wavelengths (red, orange, and blue) are layered with a visible light image from astrophotographers using ground telescopes (red, green, and blue). Messier 94 is a spiral galaxy with a bright inner ring called a starburst ring, where new stars are forming, perhaps fueled by gas driven in an oval-shaped structure shown in the composite. This is exactly the kind of “data fusion” that engineers and product teams recognize: different sensors, different strengths, stitched into one coherent narrative.
Then comes ZwCl 0024+1652, and it’s where the stakes jump from “beautiful” to “systems-level.” This is a distant galaxy cluster where astronomers have found evidence for dark matter by using specially processed data from Hubble (blue). Another Hubble image reveals the individual galaxies in the cluster (yellow and white). Chandra’s X-ray data shows the enormous reservoir of superheated gas that pervades the galaxy cluster (red), described as having much more mass than all the galaxies taken together. That contrast is the point: the gas’s behavior and the processed gravitational signal do not line up with visible matter alone, so the cluster becomes a laboratory for the kind of inference that keeps cosmology busy for decades.
Now the fun part is the sonifications, led by the Chandra X-ray Center (CXC) and included as part of NASA’s Universe of Learning program. The release outlines how each bottom-row image is converted into sound. For NGC 3603, the translation begins with a left-to-right scan where the brightness of the sources dictates volume, with compact X-ray sources heard as piano notes and diffuse X-ray emission mapped across a range of audio frequencies. The Hubble optical data becomes sustained tones and acoustic guitar harmonics. For NGC 4736, the scan moves clockwise, again linking brightness to volume, with Chandra X-rays turned into wind-like sounds that follow the X-ray emission’s shape, neutron stars and stellar-mass black holes (known as compact sources) mapped to pitched tones on a glass marimba. For ZwCl 0024+1652, the sonification starts as a circle on the outside and moves inward, peaking as the circle passes over dark matter inferred from Hubble optical observations and again at the core, while background stars are heard like a swelling glockenspiel sound and galaxies are played on a piano. Chandra’s X-rays dominate the center and are represented by airy synthesizer notes.
If you’re an operator, investor, or board member watching how institutions communicate, there’s a real second-order lesson here: data accessibility can be engineered without diluting meaning. The collaboration was driven by visualization scientist Kimberly Arcand (CXC), Matt Russo (astrophysicist), and Andrew Santaguida (musician, SYSTEM Sounds project), with Christine Malec as a consultant. NASA’s Marshall Space Flight Center in Huntsville, Alabama manages the Chandra program, while the Smithsonian Astrophysical Observatory’s Chandra X-ray Center controls science operations from Cambridge, Massachusetts, and flight operations from Burlington, Massachusetts. In other words, multiple organizations and disciplines are coordinated to keep the science pipeline intact while extending the audience pipeline.
And for peers thinking about what “impact” looks like beyond traditional channels, this is the part to underline. You can take measurements that are normally locked behind plots and specialized knowledge, translate them into visuals and then into sound, and still anchor every layer to what the instruments actually observed. The strategic stake is simple: the organizations that learn to translate complexity into experiences will win attention and trust at the same time. That’s not just branding. It’s how you keep talent interested, public funding resilient, and the pipeline of curiosity running.
This story's Key Insights and Take-aways are locked.
Create a free account to unlock Executive Actions for one credit.
Register to UnlockAlways free for Executives Club members. Join the Club
More in Science

Medici brothers' remains confirm malaria deaths, ending a Renaissance-era murder mystery
Ancient DNA pulls the plug on the speculation around Cardinal Giovanni and Grand Duke Francesco de Medici.

Chris Williams and Jessica Meir fix Canadarm2’s wrist in 7h 20m, just for Canada Day
Expedition 74 swaps a Canadarm2 wrist joint after current was seen without expected motion, restoring confirmed power connections.

NASA’s CATNLF flight test strapped to an F-15 starts at 5 a.m. for 1 aim: less fuel burn
Inside the day-by-day grind to validate laminar-flow wing tech that could cut costs for future airliners.