

Scientists use beachgoers' photos to map climate change damage to coasts
A citizen-science pipeline turns everyday snaps into coast data, helping researchers track how climate change hits shorelines.

Scientists are trying to learn more about the impact of climate change on coasts by using photos taken by beachgoers. For decision-makers, it signals a shift toward real-world, user-generated monitoring that can inform risk and planning.
Beachgoers are not just taking pictures anymore. Scientists are using people’s photos to learn more about how climate change is affecting coasts, turning casual snapshots into a research tool.
That might sound like a feel-good side project. But it matters because coastal change is hard to measure quickly and consistently. Shorelines shift, storms come and go, and the biggest signals of climate impact are often visible in the details: the state of sand, the position of the waterline, signs of erosion, and other on-the-ground cues. If you can reliably pull those clues out of photos taken at the right times and places, you can build a more continuous picture of what is changing along the coast and why.
To understand why this approach is gaining attention, it helps to know how coastal science typically works. Traditional monitoring relies on formal surveys, satellite data, and instrument networks. Those tools are powerful, but they are not always fine-grained in every location, and they can be expensive to expand. Meanwhile, the camera is everywhere, and people visit coasts constantly, especially for recreation. That creates an unusual opportunity: instead of paying only for new measurements, you can also tap into a stream of existing observations from the public.
The “turn snaps into science” idea is essentially a citizen-data strategy. Researchers collect images from beachgoers, then use them to derive information about the coast over time. This is not just about getting more data points. It is about reducing gaps. When climate impacts play out unevenly across regions, the value of localized evidence rises. A dataset built from everyday photos can help scientists spot patterns that might otherwise be missed by more centralized monitoring, particularly in less-studied areas.
There is also a practical reason this approach can scale. Photos are lightweight to distribute, easy for the public to generate, and naturally tied to time and place. That matters for climate-related questions where timing can be everything. A coastline after a storm can look very different from one before. If scientists can match images to when they were captured and where they were taken, the photos can help them study change in a way that is closer to the lived experience of coastal communities.
For executives, boards, and anyone tracking climate-risk governance, the second-order implications are bigger than it sounds. Better coastal monitoring can affect how organizations think about exposure and resilience. Coastal risk does not stop at erosion and storm damage. It can cascade into insurance decisions, infrastructure planning, and capital allocation for development, utilities, ports, and real estate. Even when a company is not directly in the research business, the presence or absence of credible monitoring influences whether risks are visible early enough to budget for mitigation.
There is also a governance angle. When user-generated data enters the picture, organizations and regulators typically care about reliability, consistency, and how findings are validated. While this article does not list specific methods or partnerships, it does highlight the core aim: scientists hope to learn more about climate change impacts through people’s photos. That framing suggests an intent to widen the evidence base, potentially complementing other measurement systems. In turn, that can change how stakeholders ask for proof. Instead of relying only on periodic surveys, decision-makers may increasingly look for data streams that capture change more frequently, across broader geographies.
Strategically, this approach is a signal to watch. It shows how climate research is leaning into distributed observation, using everyday behavior as an input to scientific measurement. If the model works, it could make coast monitoring faster and more granular, which is exactly the kind of capability that helps researchers, planners, and risk managers respond when conditions shift. The stakes are straightforward: coasts are dynamic, climate pressures are not waiting, and the more accurately we can read what is happening at the shoreline, the better prepared everyone downstream can be.
This story's Key Insights and Take-aways are locked.
Create a free account to unlock Executive Actions for one credit.
Register to UnlockAlways free for Executives Club members. Join the Club
More in Science
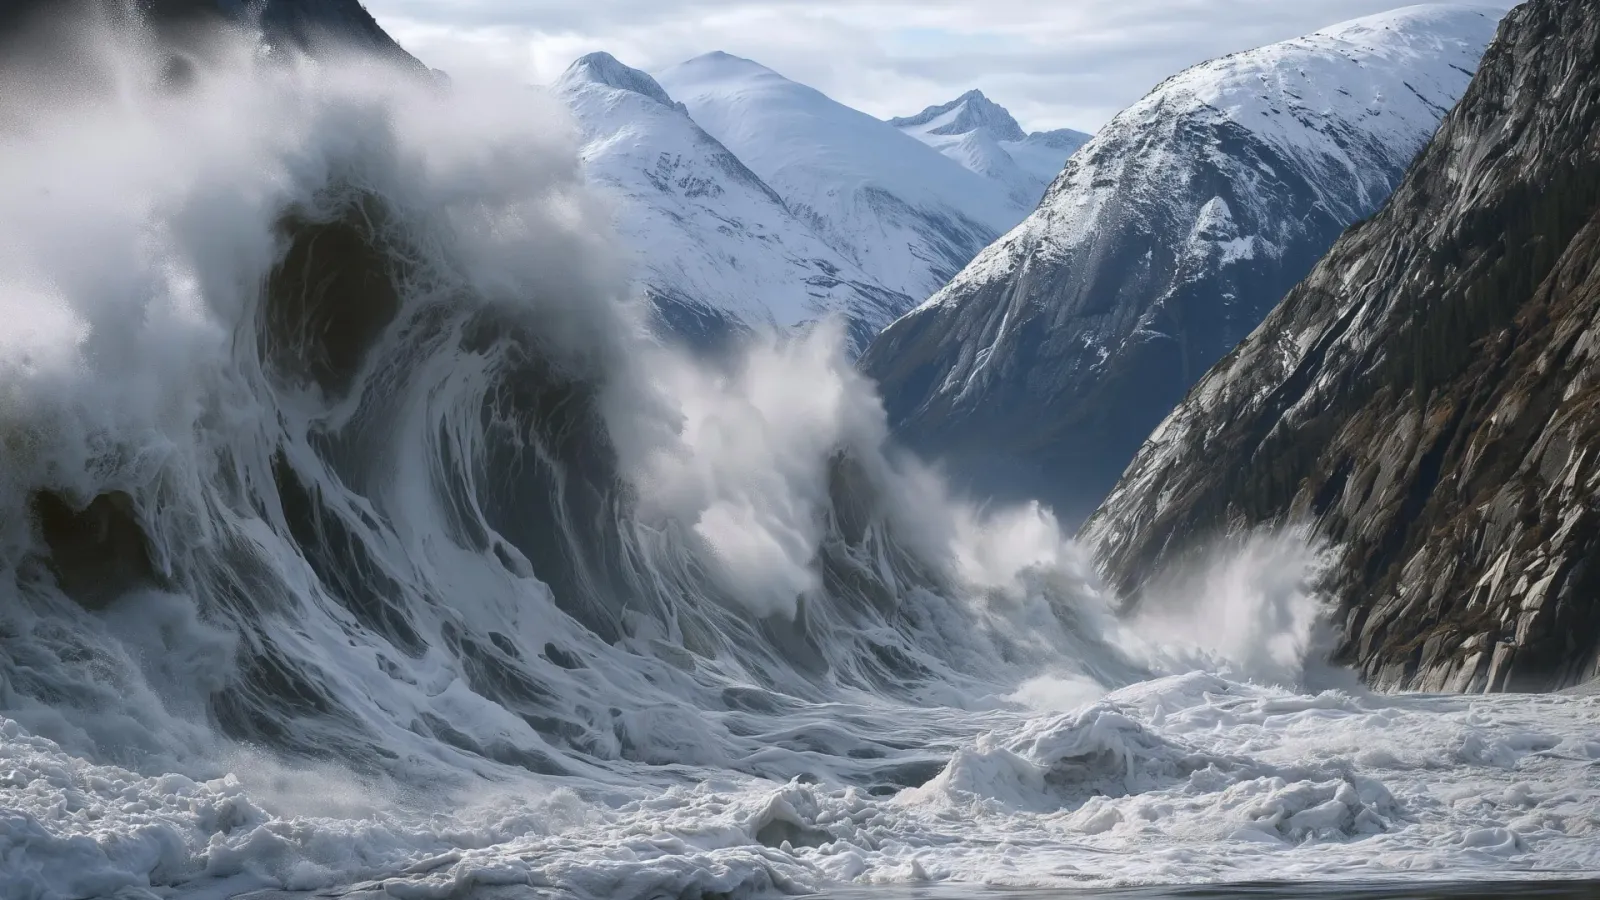
Alaska's 1,580-foot tsunami had warning signs. Scientists just found them.
Rapid glacier retreat, heavy rainfall, and thousands of tiny tremors preceded Alaska's 1,580-foot tsunami, a warning for every coastal community in a warming world.
The rare mutation that lets high-risk brains dodge Alzheimer's
Scientists found a natural defense against protein buildup, opening a new path to preventive treatments.
3,000 steps a day may halve Alzheimer's decline, study finds
New research links a modest daily walk to less tau buildup and nearly half the cognitive and functional decline, even for those with early signs.