

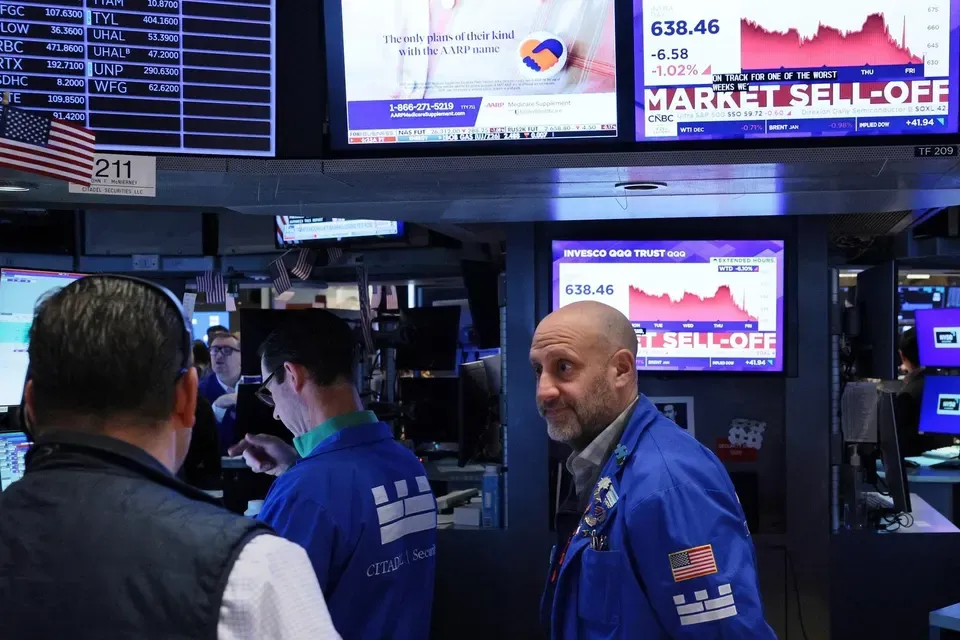
Dow and S&P 500 enter correction as Nasdaq logs worst week since 2020
All 11 S&P 500 sectors fell more than 1% in the same week for the first time since April 2025, a breadth signal that matters more than any single index level.

The Dow and the S&P 500 closed in correction territory while the Nasdaq posted its worst week since 2020, with all 11 S&P 500 sectors finishing more than 1% lower in the same week for the first time since April 2025. For decision-makers, the breadth of the decline matters more than any single index level, because market-wide de-risking hits buyback math, M&A financing, and capital-raising windows at the same time.
The Dow and the S&P 500 have both entered correction territory, and the Nasdaq just closed its worst week since 2020. A correction is not a vibe; it is a defined threshold, typically a decline of at least 10% from a recent record high, and crossing it changes how institutions are forced to talk about risk. The source material for this briefing does not name a single catalyst, and that absence is itself worth noting: this was not one headline, one earnings miss, or one policy shock. It was a broad repricing that dragged the major averages down together and left the Nasdaq, home to the largest technology and growth names, with its sharpest weekly loss in roughly five years.
The number that should stop you is not the index level. It is this: all 11 S&P 500 sectors finished more than 1% lower this week, the first time that has happened since April 2025. Sector breadth like that is rare, and it is the closest thing markets have to a confession. When energy, health care, utilities, and consumer staples all fall alongside tech, it means investors were not rotating out of one story and into another. They were reducing exposure, period. Diversification, the thing every retirement brochure promises, stops working in weeks like this one.
Worst week since 2020 is a phrase that carries weight for anyone who was watching markets that year. The last time the Nasdaq posted a comparable weekly decline, the world was in the early grip of the pandemic, and the selloff was a liquidity event as much as a valuation one. Comparisons to that period are not predictions. They are a reminder that when volatility arrives this fast, it tends to expose leverage, crowding, and positioning that looked comfortable the week before.
Corrections are, historically, a routine feature of equity markets rather than an anomaly. What is unusual here is the combination: a defined correction for two major averages, a five-year weekly low for the third, and total sector participation. Markets typically need a reason to stop falling, and that reason is usually either a change in the macro backdrop or a change in price that makes valuations compelling again. Neither is confirmed in the data we have.
Then there is the plumbing. A meaningful share of institutional money sits in strategies that mechanically adjust exposure based on realized volatility. When price swings widen, those strategies typically sell into weakness to hit their risk targets, which can amplify a move that started for unrelated reasons. Index funds and target-date retirement products do not make judgment calls; they follow flows. That means the pain is not confined to hedge funds and trading desks. It shows up in retirement statements, in pension funding ratios, and in the borrowing costs companies face when they tap credit markets.
Watch three things from here. First, whether the selling narrows. If defensives stabilize while high-multiple growth names keep falling, that is rotation. If everything keeps falling together, that is de-risking. Second, whether the next week confirms the correction or reverses it; single weeks are noisy, and the breadth statistic is only meaningful if it persists. Third, whether credit markets stay calm. Equity drawdowns that stay in equities are painful. Equity drawdowns that spill into credit are a different category of problem.
For executives and boards, the practical implications arrive quickly. A correction changes the math on buybacks, because repurchasing shares at a lower price is more accretive but also competes with cash preservation. It changes the math on M&A, because targets get cheaper while financing gets more expensive and more conditional. It changes the math on IPOs and secondary offerings, because windows that were open last month can close without warning. And it changes the tone of every board meeting, as directors ask management to walk through downside scenarios they may not have stress-tested since the last drawdown.
The headline is the correction. The story is the breadth. All 11 sectors down more than 1% in the same week, for the first time since April 2025, tells you this was not a verdict on any one company or industry. It was a market-wide repricing of risk, and the people who manage capital, hire, and plan budgets should treat it as information rather than noise.
This story's Key Insights and Take-aways are locked.
Create a free account to unlock Executive Actions for one credit.
Register to UnlockAlways free for Executives Club members. Join the Club
More in Business

S&P 500 Enters Correction, Down 10% From Its High on AI Worries
The index's slide past the 10 percent line is a symbolic verdict on investor mood, and the AI trade that powered the rally is now the thing testing it.

Chip stocks lose $2.3 trillion in a week, worst run in 25 years
A $2.3 trillion weekly wipeout in semiconductors is forcing every board with an AI story to ask whether it owns a thesis or just a crowded trade.
Nvidia and Broadcom Lead Friday Rout as S&P 500 Hits 7-Month Low
Chipmakers took the brunt of a tech-and-AI-driven sell-off, and the index's slide to a seven-month low turns AI enthusiasm into a two-way trade for every board.